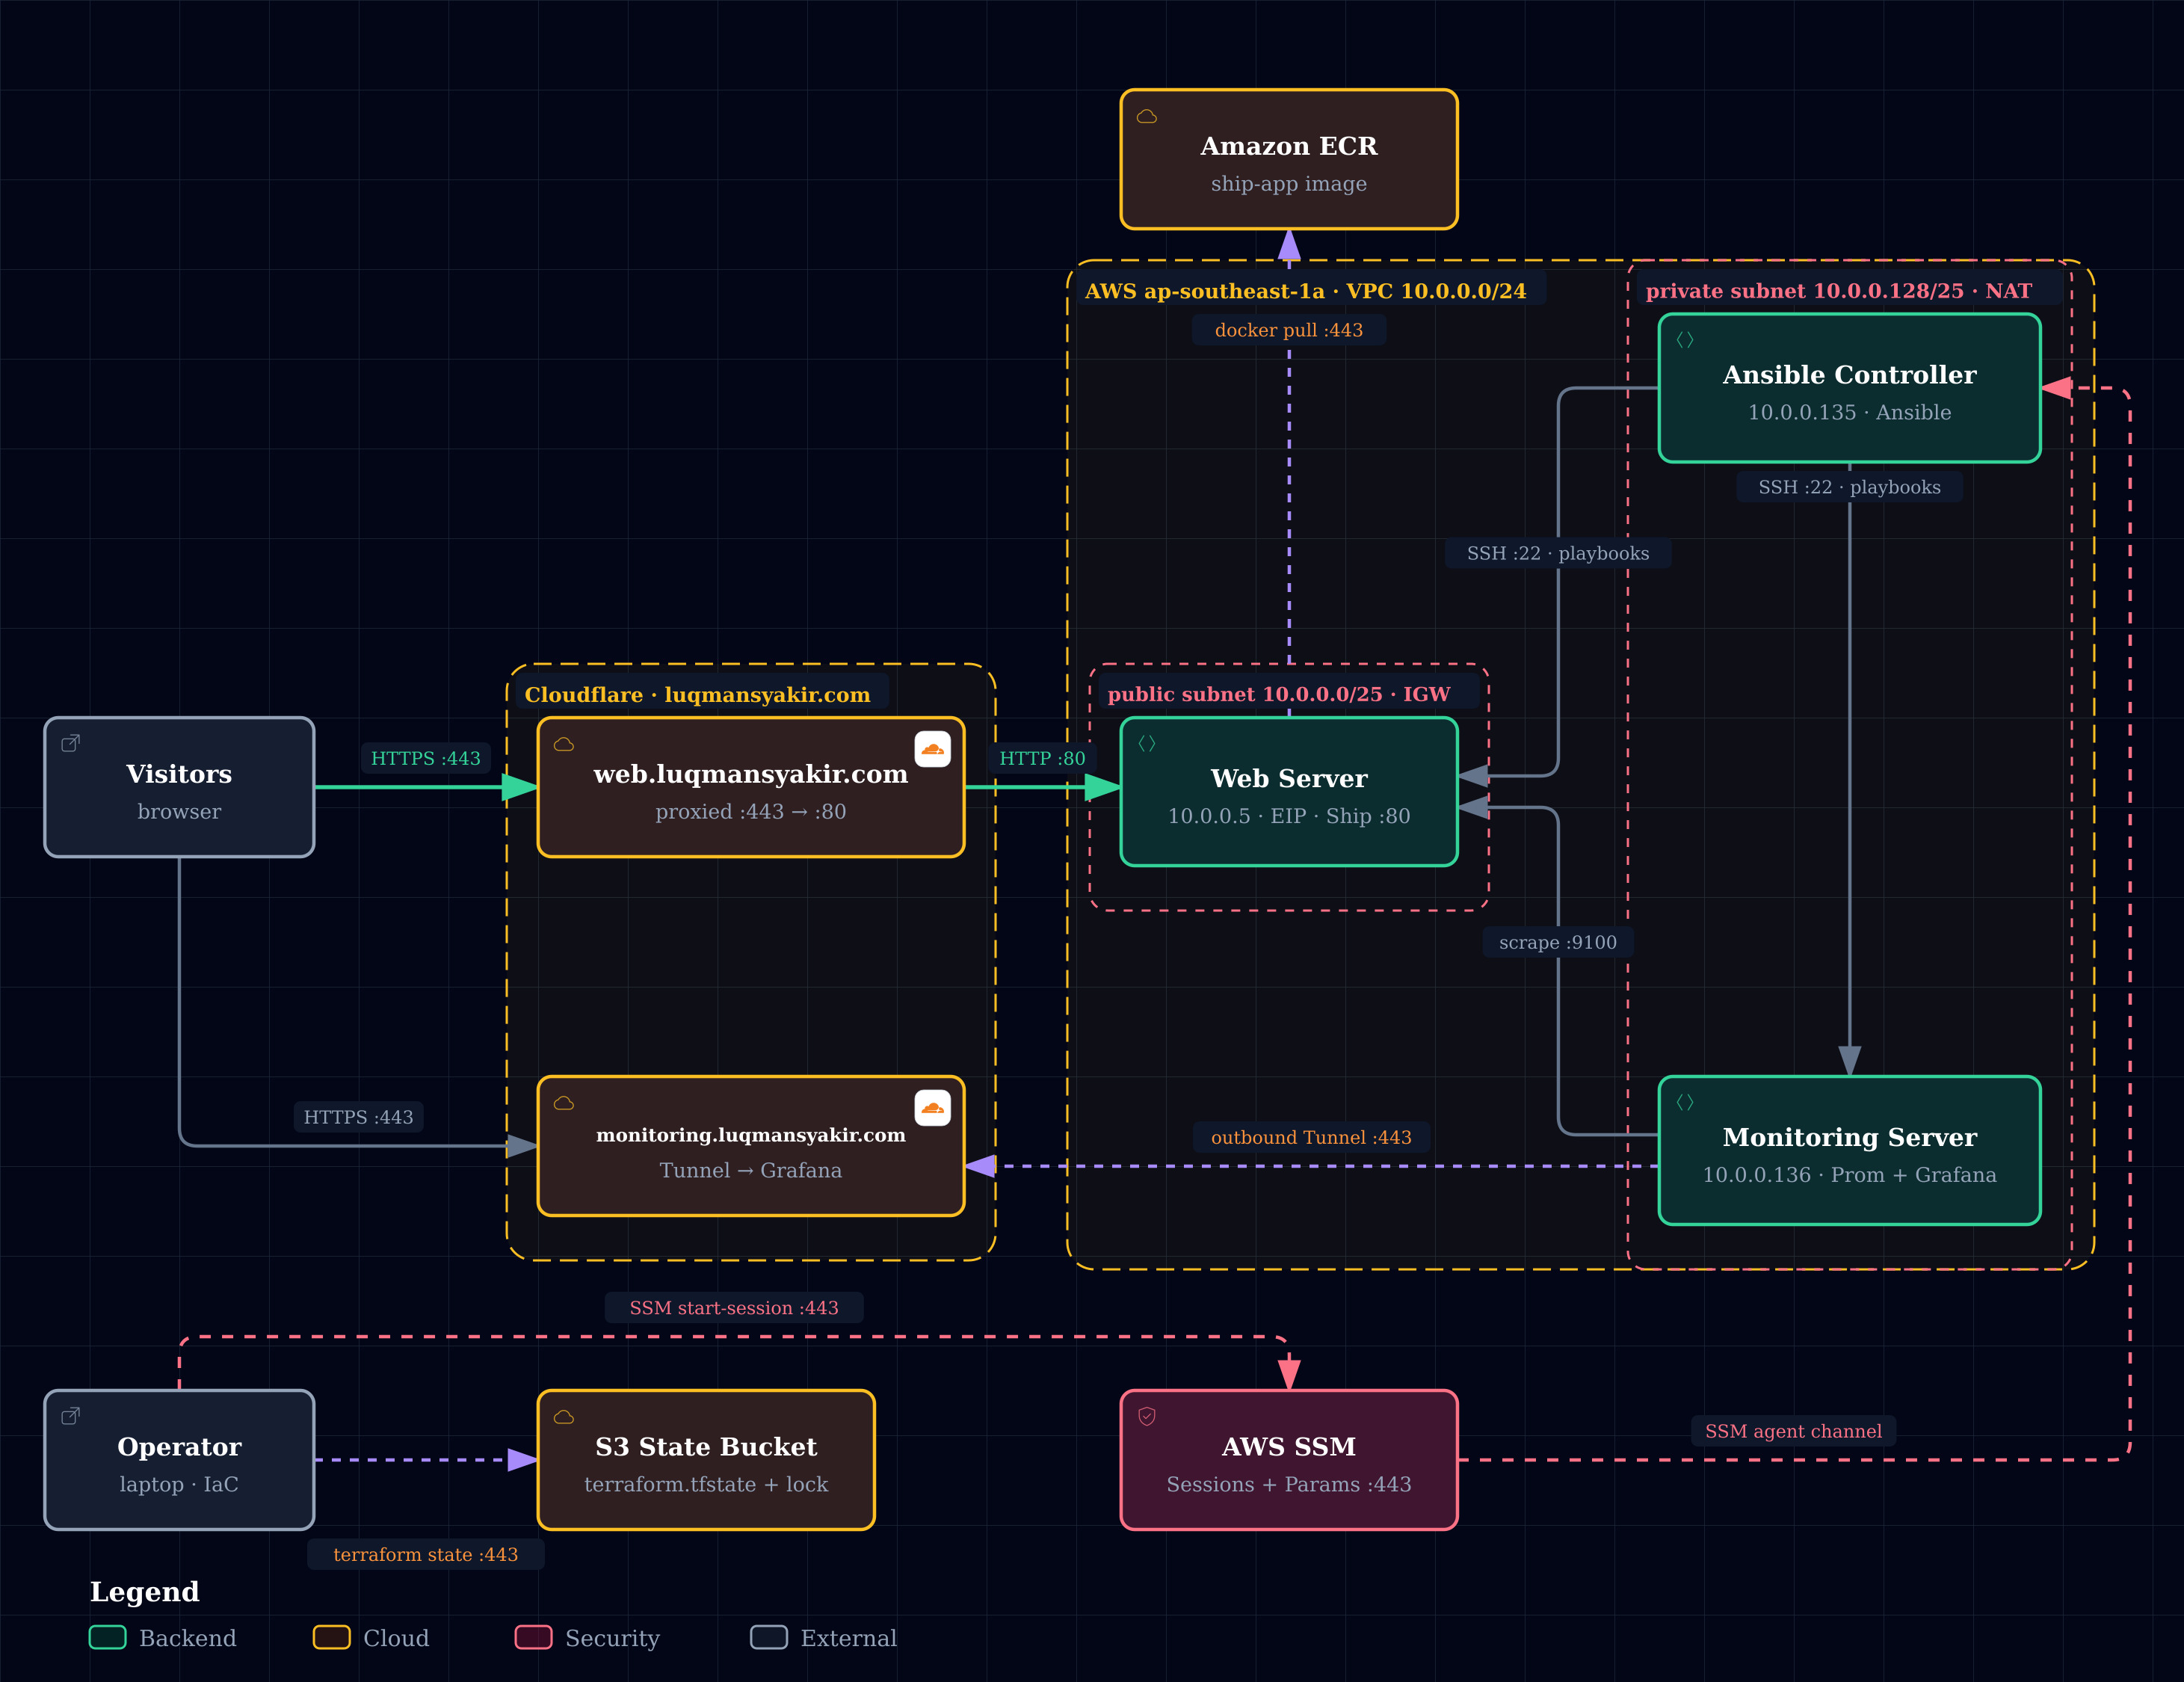
Live Links
| Service | URL | Path |
|---|---|---|
| Docs site (GitHub Pages) | https://samanz21.github.io/devops-bootcamp-project/ | docs/index.html — README + interactive architecture diagram |
| Docs site (Cloudflare Workers) | https://docs.luqmansyakir.com | Same docs, served through Cloudflare Workers |
| Web app (Ship) | https://web.luqmansyakir.com | Cloudflare (proxied A record) → EIP → nginx container |
| Grafana | https://monitoring.luqmansyakir.com | Cloudflare Tunnel → Grafana container |
Grafana ships with a pre-provisioned Node Exporter Full dashboard and Prometheus datasource — no manual setup.
Architecture
Region: ap-southeast-1 · VPC 10.0.0.0/24 · public subnet 10.0.0.0/25 (IGW) · private subnet 10.0.0.128/25 (NAT)
| Server | Private IP | Subnet | Role | Access |
|---|---|---|---|---|
| web | 10.0.0.5 |
public + EIP | Ship app container (port 80) + node_exporter | SSM |
| ansible-controller | 10.0.0.135 |
private | Runs all playbooks against the other two | SSM |
| monitoring | 10.0.0.136 |
private | Prometheus (9090) + Grafana (3000) + cloudflared | SSM |
All three use the same pinned private IPs (fixed in terraform/ec2.tf), so they survive destroy/redeploy. No SSH from the internet — everything goes through AWS SSM.
What is set up on each EC2
| Server | user_data installs | Ansible adds on top |
|---|---|---|
| web | Docker, python3-pip | app container from ECR (port 80), node_exporter |
| controller | python3-pip, Ansible, AWS CLI, Docker | everything below via setup-controller.sh |
| monitoring | Docker, cloudflared | Prometheus + Grafana compose stack, Cloudflare Tunnel service |
Automation — ansible/setup-controller.sh
One command (bash setup-controller.sh) configures the whole fleet from the laptop through SSM. What it does, in order:
- Detects the 3 instance IDs by tag
- Waits for SSM
Online+ cloud-init to finish on all - Self-heals Ansible on the controller if user_data failed
- Generates an SSH key on the controller and distributes it to web + monitoring
- Copies all playbooks, inventory, and Grafana provisioning files to the controller (base64 over SSM)
- Accepts SSH host keys, runs a connectivity test playbook
- Installs
geerlingguy.dockerrole +community.dockercollection → runs Docker install on web + monitoring - Installs node_exporter on web (
prometheus.prometheuscollection) - Deploys Prometheus + Grafana compose stack with provisioned datasource + dashboard
- Pulls the Cloudflare Tunnel token from SSM Parameter Store and installs the tunnel service on monitoring
- Deploys the app: pulls the image from ECR and runs the container on web port 80
Re-running it after any redeploy is safe — every step is idempotent.
Repo Layout
terraform/        # VPC, subnets, IGW/NAT, SGs, 3 EC2, EIP, S3 backend
├── dns.tf        # Cloudflare DNS record auto-updated to the current EIP on apply
├── ec2.tf        # 3 instances, pinned private IPs
└── userdata-*.sh # per-server bootstrap scripts
ansible/          # controller-side configuration management
├── setup-controller.sh   # the one-command fleet setup (above)
├── playbook-*.yaml       # connectivity, docker, node_exporter, monitoring, web app
├── inventory.ini.tftpl   # generated from Terraform outputs
└── grafana/              # compose + Prometheus config + provisioned dashboards
app/              # Ship app (multi-stage Dockerfile) → ECR
Deploy From Scratch
cd terraform && terraform init && terraform apply   # infra + DNS record (auto new EIP)
cd ../ansible  && terraform init && terraform apply # generate inventory
bash setup-controller.sh                            # configure everything (~15 min)
After destroy + apply, only these three steps again — the Cloudflare record repoints to the new EIP automatically (terraform/dns.tf), and no manual DNS edits are ever needed.
Monitoring Chain
node_exporter (web 10.0.0.5:9100) → Prometheus (10.0.0.136:9090) → Grafana dashboard
Scrape interval 15s. Targets: web node_exporter + Prometheus itself.
Security Notes
- Port 22 reachable only inside the VPC (controller → targets); internet access is SSM-only
- Cloudflare token and tunnel token stored in AWS SSM Parameter Store, never in the repo
- Grafana exposed only through the Cloudflare Tunnel; Prometheus/Grafana ports are VPC-internal